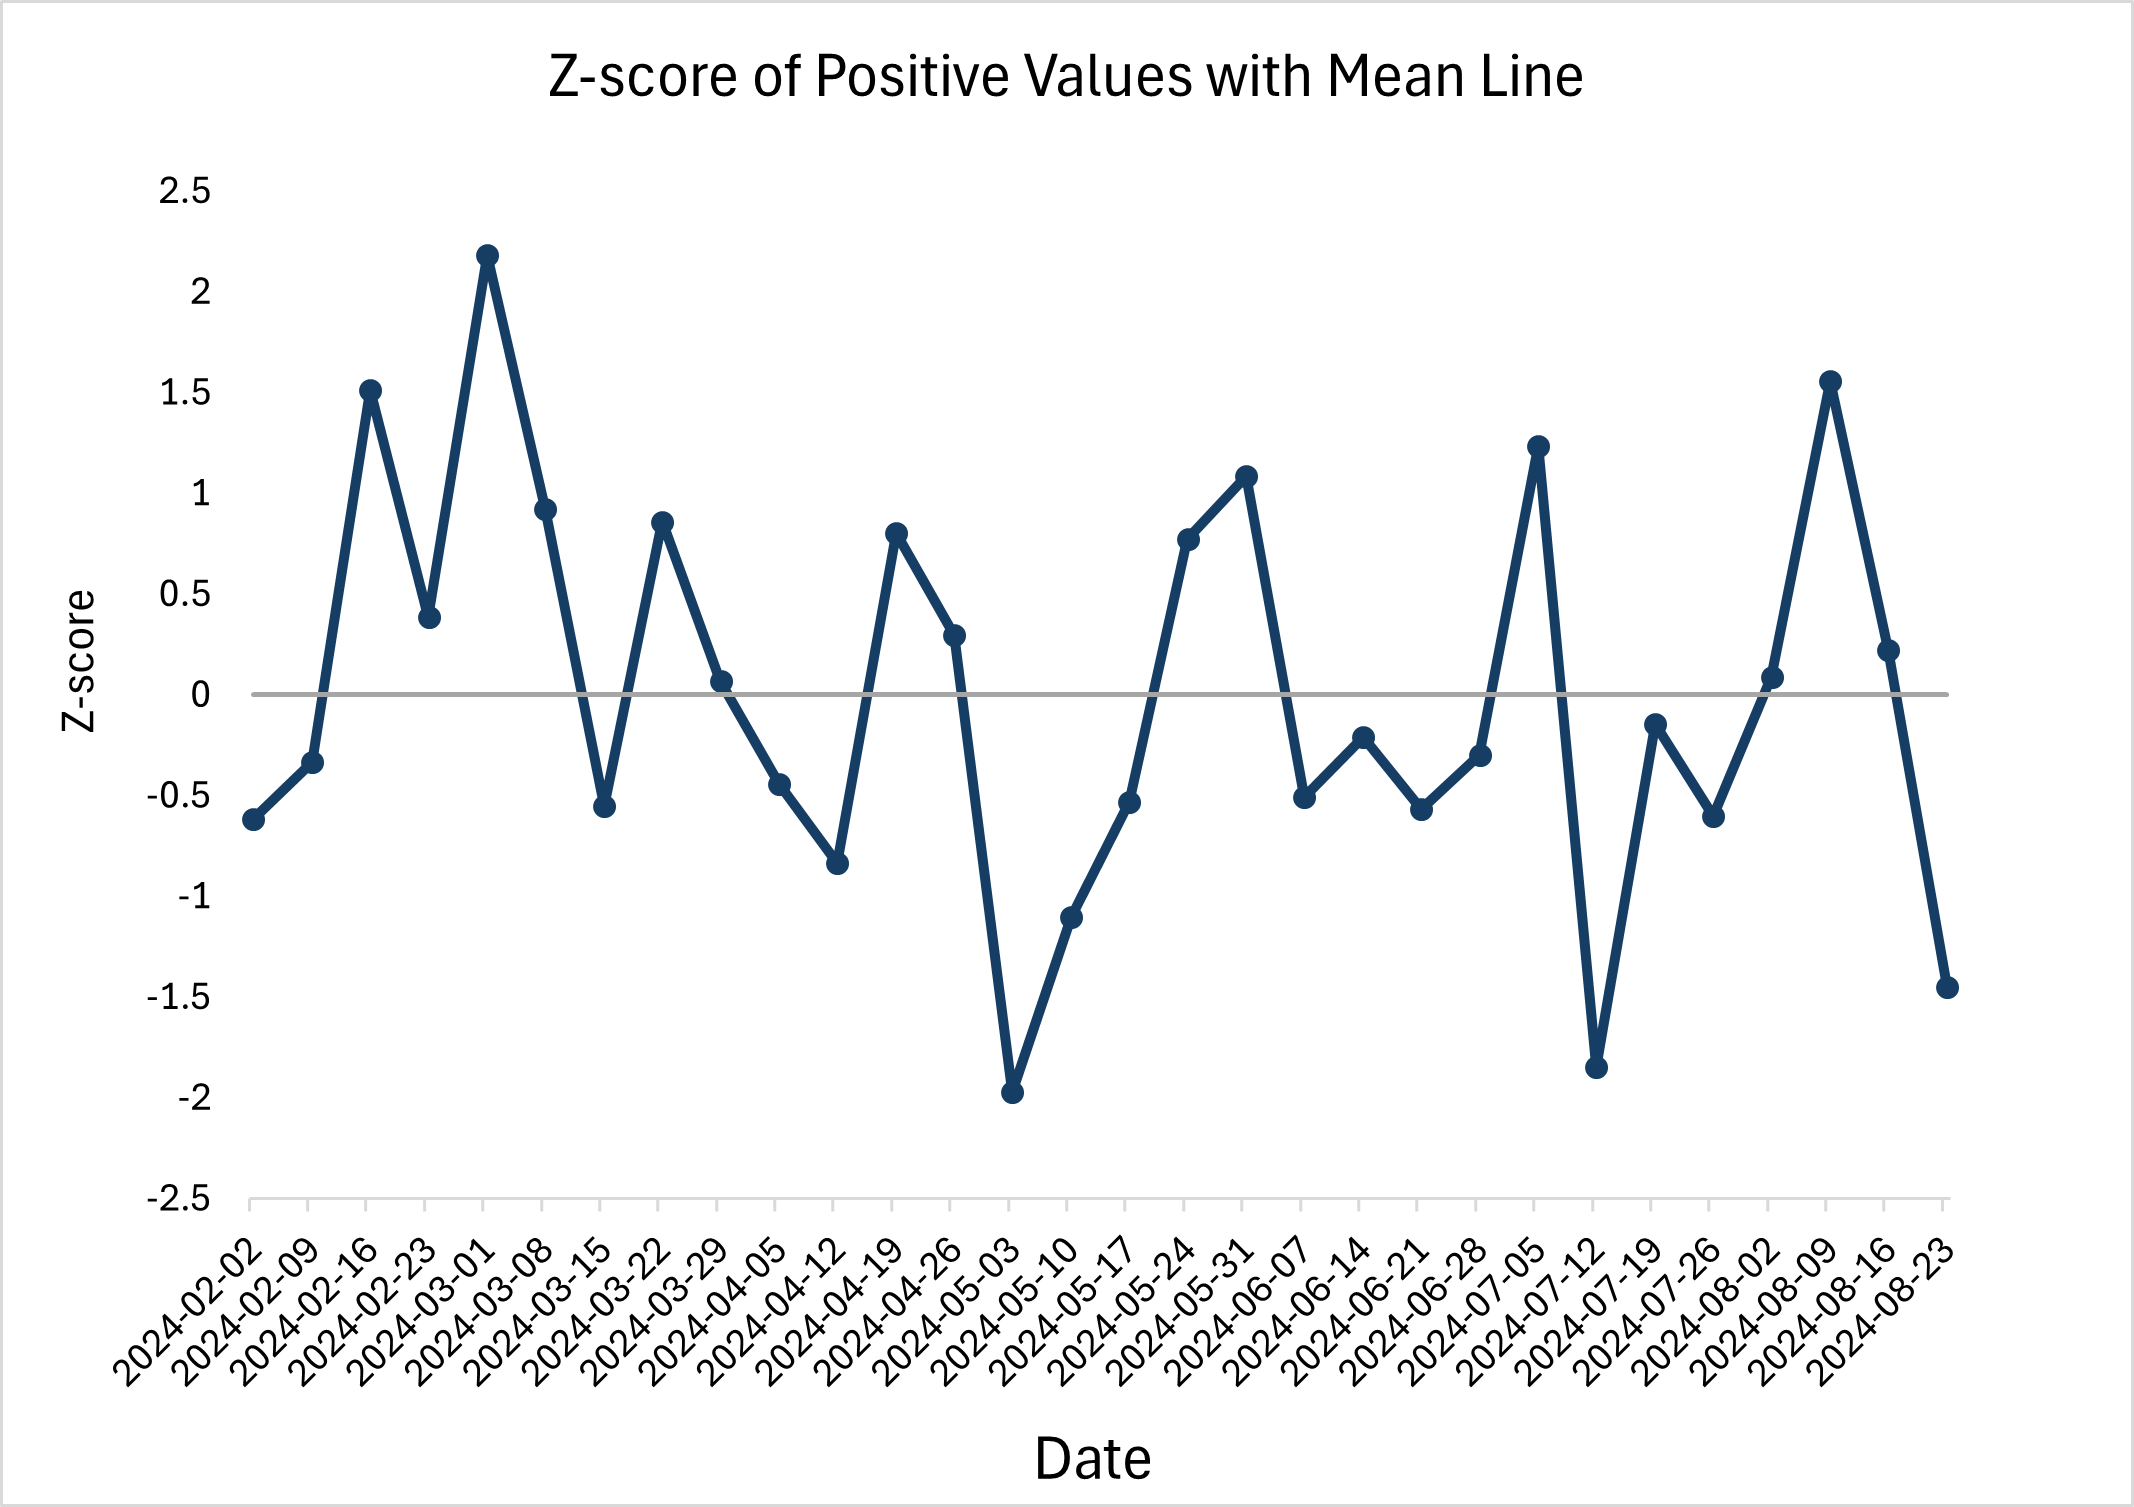
Overall, the The Index of Carbon Sentiment (TICS) report continues to showcase ample interest in the commodity and green initiatives. The z-score analysis highlights several peaks, with significant positive deviations occurring in early March and mid-August. It’s worth noting, there was a significant decline of roughly 11.95% from August 16th to August 23rd, 2024, marking one of the sharpest drops during this period. Net-net, conversations around the carbon market remains rampant.

About The Index of Carbon Sentiment (TICS):
The Index of Carbon Sentiment (TICS) is a weekly sentiment analysis of the carbon market, with a single question: What is the sentiment of social media participants on ‘Twitter’ regarding the carbon market?
Utilizing a Python script with keyword(s) related to the carbon market (e.g., ‘Voluntary Carbon Markets’) and measuring weekly sentiment from posts and comments within the last seven (7) days (e.g., ‘Monday – Sunday’). Thereinafter, utilizing Microsoft Power BI to analyze posts and comments based on three (3) sentiments: positive, neutral, or negative.
The key finding is that Natural Language Processing (NLP) is an excellent and inexpensive tool to gauge and build a confidence barometer, comprehending collective viewpoints about carbon market participants, while monitoring for varying thought patterns and overall awareness of the emission offset market, as the call to lower carbon emissions amongst and above triple helix groups accelerates globally.
While many surveys are conducted by industry groups and private consulting firms semi-annually or annually, carbon market participants can now access the weekly TICS report to measure whether amongst or above triple helix groups remain optimistic or pessimistic regarding the carbon markets.
Karbon Offsets aims to provide the ‘positive sentiment’ indices report publicly on the Karbon Offsets ‘Research Analysis’ page and on the ‘Opinion/News’ page weekly, while the weekly aggregate of ‘neutral’ and ‘negative’ sentiments report and overall qualitative data will remain on the ‘Data Portal’ subscription page. For the first month, all three sentiment scores will be publicly available.
TICS REPORT POSITIVE AND NEGATIVE FACTORS
Frequency: Weekly
Units: Percent
Merits of TICS report: The report’s dynamic and timely (weekly) analysis offers more frequent insights compared to traditional semi-annual or annual surveys, providing a view of varying thought patterns and overall awareness of the emission offset market.
Lag Factor: Not greater or less than seven (7) days
Indicators to Monitor: Equal weighting of aggregated negative and neutral sentiment and/or positive sentiment below neutral reading.
Revision Factor: None
Negatives of TICS report: The report’s drawback lies within its small data sample set, although, on aggregate, it surpasses other widely available semi-annual or annual reports and surveys. The total post and comments sample size varies weekly.


